Data Analyst Roadmap (2026): From SQL & Python to Executive Insights
Master relational SQL queries, statistical data analysis with Python and Pandas, business intelligence dashboard design (Power BI/Tableau), and data-driven storytelling.

What's in this guide
The Short Answer: Data Analytics in 2026
Data analysis in 2026 is far more than creating basic bar charts in Excel. Modern organizations are overwhelmed with raw data; they desperately need analysts who can write optimized SQL queries, run rigorous statistical tests, and translate complex numbers into actionable commercial strategy.
The most successful analysts stand out by mastering technical execution: window functions, Common Table Expressions (CTEs), statistical hypothesis testing, and interactive dashboard architecture that decision-makers actually use.
Just getting started? Read how to become a data analyst step by step for the beginner-first plan.
Data without business context is just noise. Master advanced SQL, Python data cleaning, and compelling visual storytelling to drive high-impact decisions.
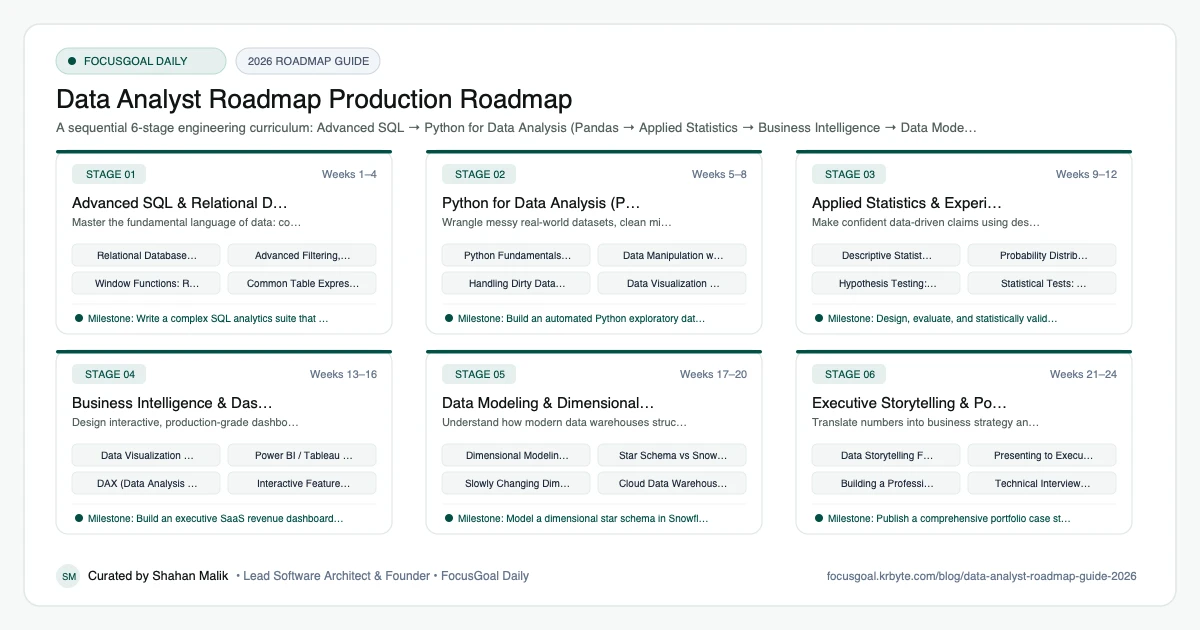
The 6 Production Stages
Follow these structured, sequential stages to systematically build production competence:
Advanced SQL & Relational Databases
Master the fundamental language of data: complex joins, window functions, CTEs, and query optimization.
Python for Data Analysis (Pandas & Polars)
Wrangle messy real-world datasets, clean missing records, and transform data using Python and modern dataframes.
Applied Statistics & Experimentation (A/B Testing)
Make confident data-driven claims using descriptive and inferential statistics, probability, and hypothesis testing.
Business Intelligence & Dashboard Engineering
Design interactive, production-grade dashboards using Power BI or Tableau with clear visual hierarchy.
Data Modeling & Dimensional Warehouses
Understand how modern data warehouses structure business metrics: Star Schema, Snowflake Schema, and dbt.
Executive Storytelling & Portfolio Case Studies
Translate numbers into business strategy and present compelling findings to non-technical stakeholders.
Is a Data Analyst Career Worth It in 2026?
Data analysis remains a practical entry point into tech and business because almost every organization collects data and needs people to interpret it. The role suits people who enjoy investigating questions, spotting patterns, and explaining findings to non-technical colleagues. Compared with some other tech paths, the starting tools, SQL, spreadsheets, and a BI tool, are approachable.
The caveats are worth knowing. Entry-level openings can attract many applicants, and AI tools are changing routine reporting work. Analysts who understand the business, write good SQL, and communicate clearly are harder to replace. Pay and demand vary by country and industry, so check current local job listings.
- Best fit: curious, detail-oriented people who like explaining things.
- Learning curve: SQL and dashboards are quick to start; statistical thinking takes longer.
- Durable skills: SQL, data cleaning, storytelling, and domain knowledge.
Data Analyst vs Data Scientist vs Data Engineer: Which to Learn First
Data analysts focus on answering business questions with queries, dashboards, and reports. Data scientists lean into statistics and predictive modeling; the Machine Learning Roadmap covers that side. Data engineers build the pipelines and warehouses that deliver trustworthy data, as described in the Data Engineer Roadmap.
Analytics is usually the gentlest first step because you see results quickly and learn how data is used in a business. Many people later move toward engineering or modeling once they know which part they enjoy.
Data Analyst Setup: Tools You Need
You can begin with free tools on an ordinary laptop. Start with a spreadsheet application, then add a database to practice SQL and a visualization tool for dashboards. Python with pandas becomes valuable once your datasets outgrow spreadsheets or you need repeatable analysis.
Choose one tool per category and learn it well. Employers differ in which BI tool they use, but the underlying skills transfer.
- Spreadsheets for quick exploration and pivot tables.
- SQL with a practice database such as PostgreSQL or SQLite.
- A BI tool such as Power BI, Tableau, or Looker Studio.
- Python with pandas and a notebook for deeper analysis.
- Git for versioning queries and notebooks.
Data Analyst Portfolio Projects and How to Get a Job
A good analytics portfolio shows a question, the data you used, your method, and a clear recommendation. Hiring managers read many portfolios that stop at charts, so end each project with what a decision-maker should do differently.
For interviews, practice SQL problems involving joins, aggregations, and window functions, and be ready to walk through a messy dataset you cleaned. Tailor your resume to the industry you are applying to.
- A sales or marketing dashboard built from a public dataset, with written insights.
- A SQL case study answering five business questions on a multi-table database.
- A data-cleaning project documenting every fix you made and why.
- An A/B test analysis explaining how you judged the result.
- A one-page summary of each project linked from your resume.
Beginner Pitfalls vs Production Reality
Self-taught developers commonly waste months making avoidable structural mistakes. Here is how production engineers approach these challenges:
Master Data Analytics Discipline with FocusGoal Daily
Becoming an elite data analyst requires mastering both technical coding and commercial business intuition. FocusGoal Daily breaks this syllabus into daily micro-habits.
- Structured path covering Advanced SQL, Python dataframes, A/B testing, and Power BI.
- 100% offline study support powered by local SQLite database on Android.
- In-app Ask AI tutor to clarify window functions, DAX formulas, and p-values.
- Daily streak tracking to ensure continuous analytical momentum.
Track this roadmap,
one topic at a time.
Download FocusGoal, pick this roadmap and finish your first daily topic in minutes.
Frequently Asked Questions
Do I need to learn Python or is SQL + Power BI enough?
SQL and Power BI are enough for many junior reporting roles. However, knowing Python (Pandas) dramatically expands your capability, allowing you to perform advanced statistics, machine learning, and automated data pipelines.
What is the difference between a Data Analyst and a Data Scientist?
Data Analysts focus on understanding historical data to answer 'what happened and why', while Data Scientists typically build complex predictive models and custom algorithms to answer 'what will happen'.
How long does it take to learn data analysis from scratch?
With consistent daily practice of 1.5 to 2 hours, most learners acquire strong job-ready analyst skills in 4 to 6 months.
How do I become a data analyst with no experience?
Learn SQL, spreadsheets, and one BI tool, then complete two or three portfolio projects on real datasets. Apply for junior analyst and internship roles and tailor your resume to the industry.
Is SQL or Python more important for a data analyst?
SQL is usually more important at the start because most analyst roles query databases daily. Python becomes valuable for larger datasets, automation, and statistical analysis.
Do data analysts need to know statistics?
Yes, at a foundational level: averages, distributions, correlation, sampling, and hypothesis testing. You do not need advanced maths to begin, but it helps you avoid misleading conclusions.
Can I become a data analyst without a degree?
It is possible, though it depends on the employer. Strong SQL skills and a portfolio that demonstrates real analysis can make up for the lack of a formal degree in many cases.
Which BI tool should I learn first: Power BI or Tableau?
Check which appears most often in job listings in your area and learn that one first. Both teach the same core ideas, so skills transfer between them.
How does FocusGoal Daily help aspiring data analysts?
FocusGoal Daily organizes the extensive analytics roadmap into manageable daily learning checklists with offline progress tracking on Android.
Start Your Data Analyst Roadmap Today
Follow structured daily goals, study 100% offline with local SQLite, and get on-demand AI guidance with FocusGoal Daily on Android.
Get FocusGoal Daily Free on Google Play